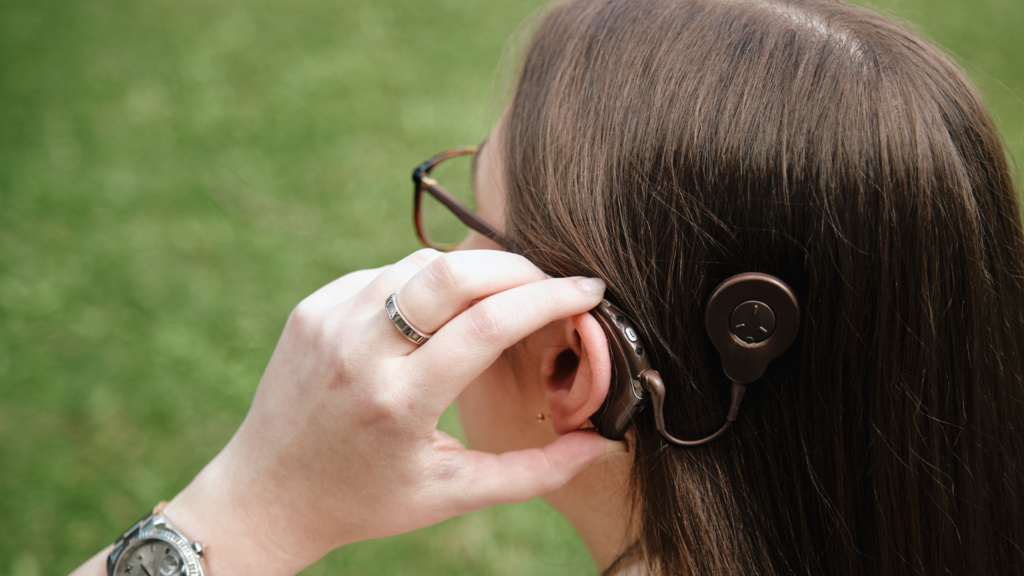
An audiogram is a graph that displays the results of a hearing test. It shows the softest sounds someone can hear at different pitches (low, mid, and high frequency sounds), including those required to hear and understand speech (the major speech frequencies). Where the results fall on the audiogram reflects how loud a sound must be for someone to hear it and which speech and environmental sounds can be heard and not heard at their normal volume.
If you or someone you know has had their hearing tested, you might have seen a chart like this: